Thermal residual stress and bow regulation of chemical-vapor-deposition diamond films by engineered interface
Paper details
Section titled “Paper details”| Field | Value |
|---|---|
| Journal | Materials Today Communications |
| Published | 2026-10-26 |
| Authors | Zhao Zhang, Qijun Wang, Fang Dong, Qing Peng, Kang Liang |
| DOI | 10.1016/j.mtcomm.2026.116494 |
Finite element simulations predicted that a periodic trapezoidal silicon interface can reduce CVD diamond film bow by up to 10.5%. At 0.30 mm embedded thickness, the model reduced maximum S11 and S22 stresses by 11.3% and 20.2% relative to a flat interface. These cases used the 800 ℃ deposition condition. The authors selected 0.25 mm as the overall compromise, and no physical diamond film was deposited or tested.
Interface and thermal model
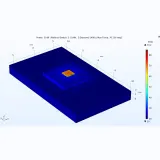
Section titled “Interface and thermal model”The proposed interface places a repetitive trapezoidal pattern in silicon before diamond deposition. The baseline geometry used a 0.20 mm embedded thickness, a 50.64° sidewall angle, a 0.30 mm bottom width, and a 0.20 mm upper width. The diamond film was 0.30 mm thick. The silicon substrate was 25.40 mm wide and 0.40 mm thick. A flat interface called F used the same thicknesses for comparison. The trapezoidal design was called UT.
ABAQUS modeled a symmetric half-structure with four-node plane strain elements and full integration. Film and substrate shared bonded nodes at the interface. A 0.02 mm mesh followed sensitivity analysis. Diamond used a Young’s modulus of 1000 GPa and a Poisson’s ratio of 0.20. Silicon used a Young’s modulus of 169 GPa and a Poisson’s ratio of 0.30. Temperature-dependent CTE curves drove cooling from the 800 ℃ deposition condition.
The model included thermal residual stress only. It excluded intrinsic stress from lattice mismatch, grain coalescence, defects, and grain boundaries. The authors considered thermal mismatch dominant for high-temperature CVD diamond on silicon. They argued that interface shape mainly changes macroscopic thermal stress.
Stress redistribution
Section titled “Stress redistribution”With flat F, the diamond interface carried compressive S11, while the silicon interface carried tensile S11. The diamond surface became tensile through the thickness. The authors attributed this to a neutral axis inside the film. S22 concentrated at the film edge, and S12 concentrated about 0.04 mm from that edge.
UT produced periodic stress along the x direction because of the repeated trapezoids. S11 was compressive at both peaks and valleys, with greater compression at each peak. S22 concentrated at the waist, with positive stress in diamond and negative stress in silicon. S12 concentrated at the four geometric corners.
At an embedded thickness of 0.20 mm, UT produced a 340.9 MPa maximum S11, compared with 398.6 MPa for F, a 14.5% reduction. UT’s minimum S11 was -619.0 MPa, compared with -628.9 MPa for F. Maximum S22 fell from 455.0 to 418.3 MPa, an 8.1% reduction. Maximum S12 rose from 188.8 to 328.6 MPa, a 74.0% increase. Bow fell only from 1.14 to 1.12 mm, a 1.75% reduction.
The lower S11 and S22 support the authors’ inference of fewer microcracks and dislocations. No crack or dislocation density was measured.
Embedded thickness trade-off
Section titled “Embedded thickness trade-off”Increasing embedded thickness changed the balance between bending and stress. The authors tested four depths: 0.15, 0.20, 0.25, and 0.30 mm.
| Embedded thickness, mm | Bow, mm | Maximum S11, MPa | Maximum S22, MPa | Maximum S12, MPa |
|---|---|---|---|---|
| 0.15 | 1.15 | 358.1 | 428.5 | 326.0 |
| 0.20 | 1.12 | 340.9 | 418.3 | 328.6 |
| 0.25 | 1.08 | 340.5 | 397.3 | 337.9 |
| 0.30 | 1.02 | 353.7 | 363.1 | 354.9 |
The table lists positive maxima. Each minimum stress remains negative in the paper’s data.
Compared with 0.15 mm, the 0.30 mm design reduced bow by 11.3% and maximum S22 magnitude by 15.3%. It made minimum S11 13.3% less compressive and raised maximum S12 by 8.9%. Against F, the 0.30 mm design reduced bow by 10.5%. It also reduced maximum S11 and S22 by 11.3% and 20.2%.
The authors selected 0.25 mm, where maximum S11 was lowest at 340.5 MPa. Bow was 1.08 mm and maximum S22 was 397.3 MPa. At 0.30 mm, bow fell to 1.02 mm and maximum S22 to 363.1 MPa. Maximum S11 rose to 353.7 MPa, and maximum S12 to 354.9 MPa. The conclusion favors 0.25 to 0.30 mm.
Substrate thickness controls the benefit
Section titled “Substrate thickness controls the benefit”At 1.00 mm substrate thickness, UT produced 0.61 mm bow, compared with 0.65 mm for F. At 2.00 mm, the values were 0.31 and 0.34 mm. At 3.00 mm, they were 0.22 and 0.23 mm.
At 3.00 mm, UT had 295.7 MPa maximum S11, compared with 216.7 MPa for F. Its maximum S12 was 401.8 MPa, compared with 181.9 MPa. These increases were 36.5% and 120.9%, respectively. UT minimum S11 reached -941.3 MPa, compared with -636.0 MPa for F. The compressive magnitude was 48.0% larger.
Table 3 gives UT maximum S22 as 383.9 MPa, below F at 423.1 MPa. This conflicts with the prose’s claim that UT raises maximum S22 at every substrate thickness.
The authors attribute the trend to substrate rigidity. Thick substrates restrict bending and shift mismatch strain toward sharp corners. Compliant substrates let the interface redistribute strain and reduce bow, S11, and S22.
The paper reports a 10.2% bow reduction at 3.00 mm. The tabulated 0.22 and 0.23 mm values do not support that percentage.
Validation and model limits
Section titled “Validation and model limits”The flat-interface calculation was checked against Hsueh’s bilayer theory. That model assumes thickness-direction strain continuity, zero in-plane force, and zero moment. Simulation and theory gave the same S11 trend along Line 1. Their average percentage error was 15.5%.
Flat-interface bow was 1.14 mm by simulation and 0.99 mm by theory, a 13.2% relative error. These checks support relative comparisons between shapes.
Analytical theory uses temperature-independent properties and an infinite structure. FEM uses temperature-dependent CTE and finite edge constraints, causing localized stress redistribution.
Fixed room-temperature moduli may overestimate stress near deposition temperature because both materials soften. The authors call this a conservative upper bound. Applying the same moduli to every shape preserves relative trends.
Intrinsic growth stress remains outside the model. Reported improvements are predictions for thermal residual stress, not measured total stress.
Prior work reported -0.25 GPa diamond macro-stress with an Al-Si-N interlayer. A roughened iridium study reduced intrinsic stress from 3.2 to 1.2 GPa. These use different stress components and interfaces, so they are not direct benchmarks.
No physical CVD deposition, bow measurement, or stress measurement was performed. The reported 10.5% bow reduction therefore remains a theoretical prediction.
Two reporting ambiguities affect reuse. Section 2 gives a 0.40 mm substrate, while Section 3.3 uses 1.00, 2.00, and 3.00 mm. One results sentence labels the 20.2% S22 reduction as S12, while the abstract and Table 2 support S22.
Fabrication path and growth risks
Section titled “Fabrication path and growth risks”KOH anisotropic wet etching is feasible and scalable. Crystallography fixes typical sidewalls at 54.7° along {111} planes, limiting adjustment of the model’s 50.64° angle and trench depth. Deep reactive ion etching offers more control but higher complexity and cost.
The authors identify seed aggregation inside trenches and seed depletion at sharp ridges as risks for interfacial voids and local defects.
Filleting the trapezoidal corners is recommended for strongly adhered coatings, but no filleted profile was tested. For free-standing diamond, elevated S12 can aid spontaneous cooling-stage debonding from silicon.
Future work combines isogeometric shape optimization with heat-transfer coupling.
Implications for diamond device engineering
Section titled “Implications for diamond device engineering”For thermal management, lower bow addresses a constraint during later component processing. Diamond’s room-temperature thermal conductivity is approximately 1800 W/(m⋅k), while stress and shape remain separate concerns.
Design depends on the product. Free-standing films may benefit from higher S12, while adherent heat sinks need lower corner shear. Engineers should select embedded thickness, substrate thickness, and corner radius together. They should then measure bow and stress on deposited samples.
The study does not compare single-crystal with polycrystalline diamond. It also does not measure dislocation density, microcracks, or total residual stress. The interface result therefore supports process screening, not selection between diamond grades.
Materials and support
Section titled “Materials and support”For CVD diamond films on silicon where bow and residual stress affect handling, 6CCVD’s diamond materials catalog lists single-crystal and polycrystalline MPCVD-grown diamond with thickness from 0.1 to 500 micrometers and plates or wafers up to 125 mm. The paper’s 0.30 mm film fits that range, but its patterned silicon interface needs separate custom fabrication. Questions can be directed to engineering support, while physical stress and bow validation remains necessary.
View Original Abstract
In this study, innovative trapezoidal interface morphologies between diamond films and silicon substrates are proposed and their influences on the thermal residual stress and bow during the cooling process are investigated. Through finite element modeling and theoretical validation, we demonstrate that compared to the conventional flat interface shape, the optimal novel interface morphology not only reduces the bow by up to 10.5%, but also decreases the magnitudes of the maximum thermal residual S11 and S22 stresses by 11.3% and 20.2%, respectively, which is greatly beneficial for suppressing dislocations and microcracks. Additionally, the effects of the novel interface morphologies with different embedded thicknesses and substrate thicknesses on the mechanical behaviors are examined. This study provides a new paradigm for regulating the thermal residual stress and bow in chemical-vapor-deposition diamond film through engineered interface, which could be used in the growth of low-stress and high-quality diamond films.

Free Standing Polycrystalline Cvd Diamond Membrane
View Specs →
Single Crystal Cvd Diamond Plate
View Specs →